原创2026/3/5大约 1 分钟
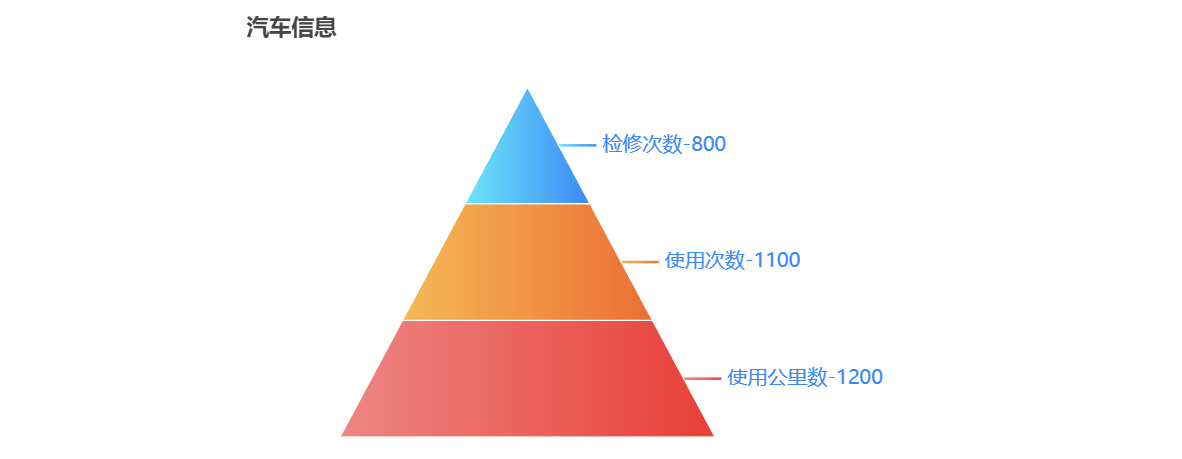
漏斗图(Funnel)或金字塔是一个倒(正)三角形的条形图,适用于业务流程比较规范、周期较长、环节较多的流程分析。 漏斗图也是常用的 BI 类图表之一,通过漏斗图或金字塔对各环节业务数据进行比较,不仅能够直观地发现和说明问题,而且可以通过漏斗图分析销售各环节中哪些环节出了问题。 为了更直观地查看电商网站数据
import * as echarts from 'echarts'
export default {
  install: (app: any) => {
    app.config.globalProperties.$leida = (id: any) => {
      var chartDom = document.getElementById(id)!
      if (chartDom == null) {
        return
      }
      echarts.dispose(chartDom)
      var myChart = echarts.init(chartDom, '', { width: 800, height: 500 })
      var option = {
        title: {
          text: '汽车信息',
        },
        tooltip: {
          trigger: 'item',
          formatter: '{b} : {c}%',
        },
        series: [
          {
            name: '漏斗图',
            type: 'funnel',
            width: '50%', // 图的大小
            sort: 'ascending', //设置漏斗图方向,
            labelLine: {
              //视觉引导线样式
              length: 30,
              lineStyle: {
                width: 2,
                type: 'solid',
              },
            },
            label: {
              formatter: (data: any) => {
                return data.data.name + '-' + data.data.num
              },
              color: ['#CD6235'],
              fontSize: '16px',
            },
            itemStyle: {
              color: function (params: any) {
                var colorList = [
                  {
                    colorStops: [
                      {
                        offset: 0,
                        color: '#EE8684', // 0% 处的颜色
                      },
                      {
                        offset: 1,
                        color: '#E83F35', // 100% 处的颜色
                      },
                    ],
                  },
                  {
                    colorStops: [
                      {
                        offset: 0,
                        color: '#F3BA56', // 0% 处的颜色
                      },
                      {
                        offset: 1,
                        color: '#EC6E34', // 100% 处的颜色
                      },
                    ],
                  },
                  {
                    colorStops: [
                      {
                        offset: 0,
                        color: '#6EE7FA', // 0% 处的颜色
                      },
                      {
                        offset: 1,
                        color: '#3B88F5', // 100% 处的颜色
                      },
                    ],
                  },
                ]
                return colorList[params.dataIndex]
              },
            },
            emphasis: {
              label: {
                fontSize: 20,
              },
            },
            data: [
              { value: 60, name: '使用公里数', num: 1200 },
              { value: 40, name: '使用次数', num: 1100 },
              { value: 20, name: '检修次数', num: 800 },
            ],
          },
        ],
      }
      myChart.setOption(option)
    }
  },
}至此,本章节的学习就到此结束了,如有疑惑,可对接技术客服进行相关咨询。